Image & Signal
The Image & Signal setting decides which shades of gray Vexy Lines pays attention to when it traces your image, anywhere from pure black to pure white.
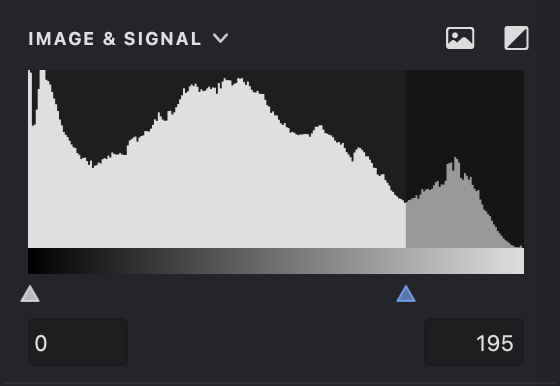
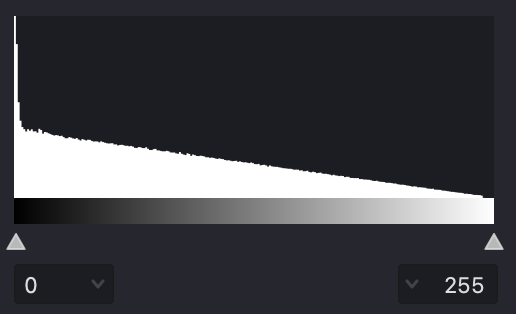
Picture a scale from 0 to 255: 0 is pure black, 255 is pure white, and every number between is a shade of gray. The histogram plots how often each shade shows up in your image, darks on the left and lights on the right, with taller columns for the shades that appear most.
 Invert — flips the threshold into inverted mode.
 Image/Histogram — shows the source image or histogram.
| image | histogram |
|---|---|
 |
 |
Controlling line thickness
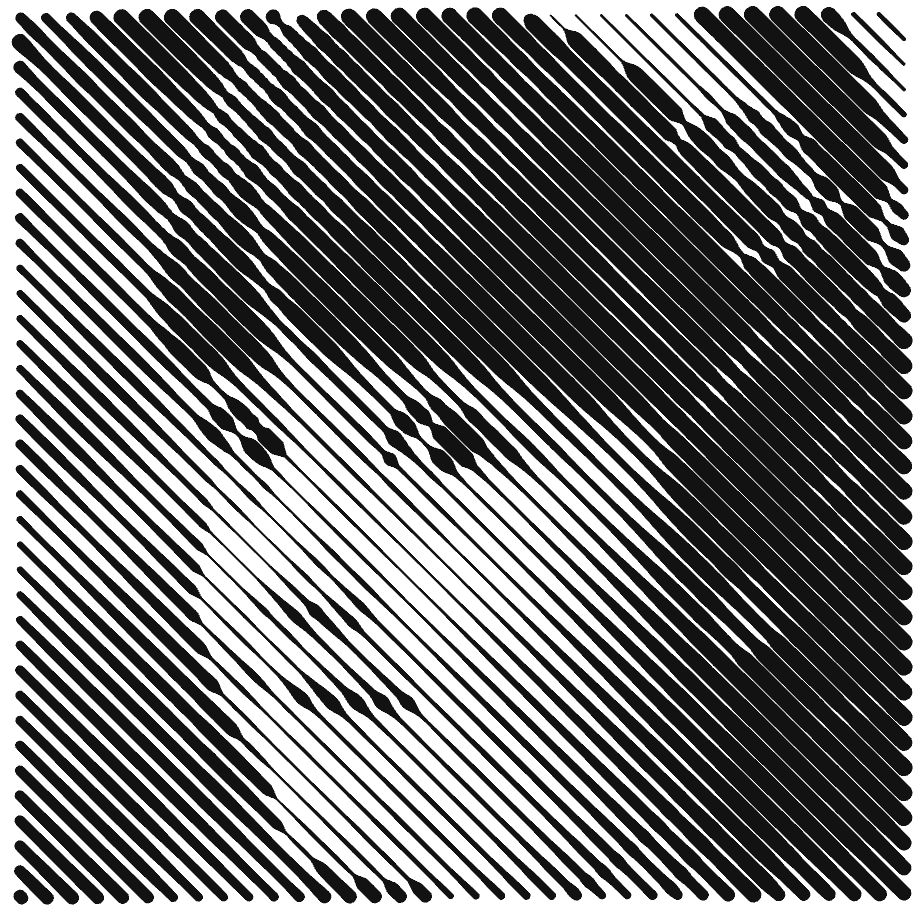
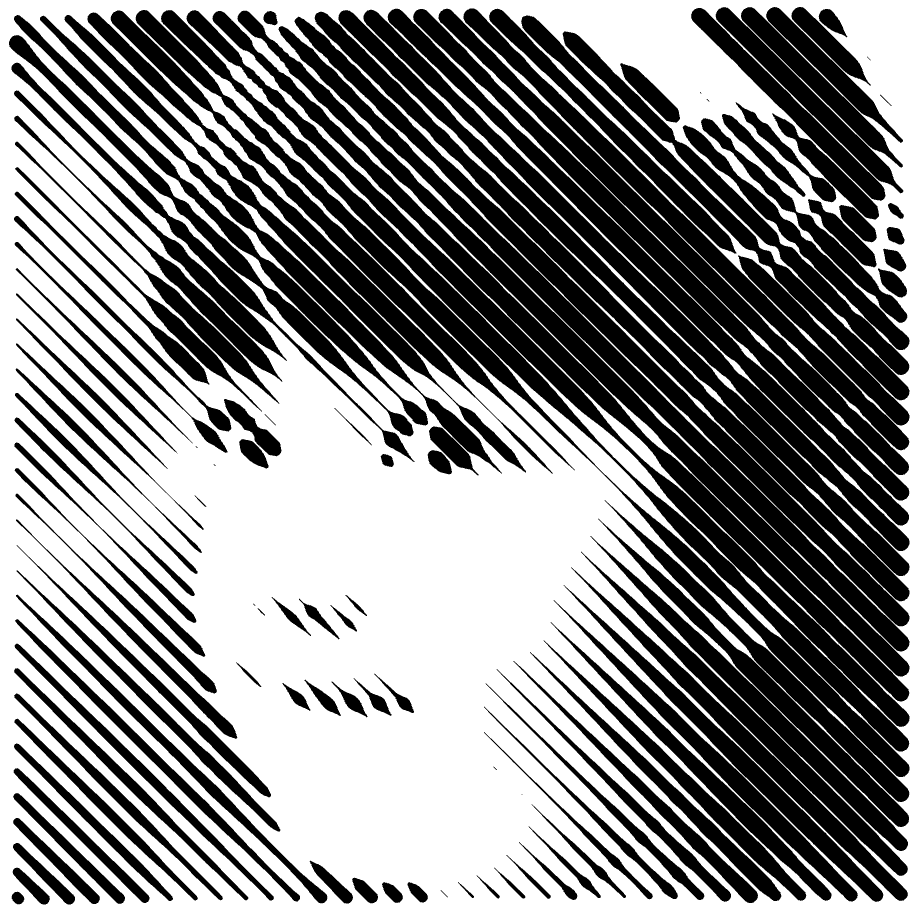
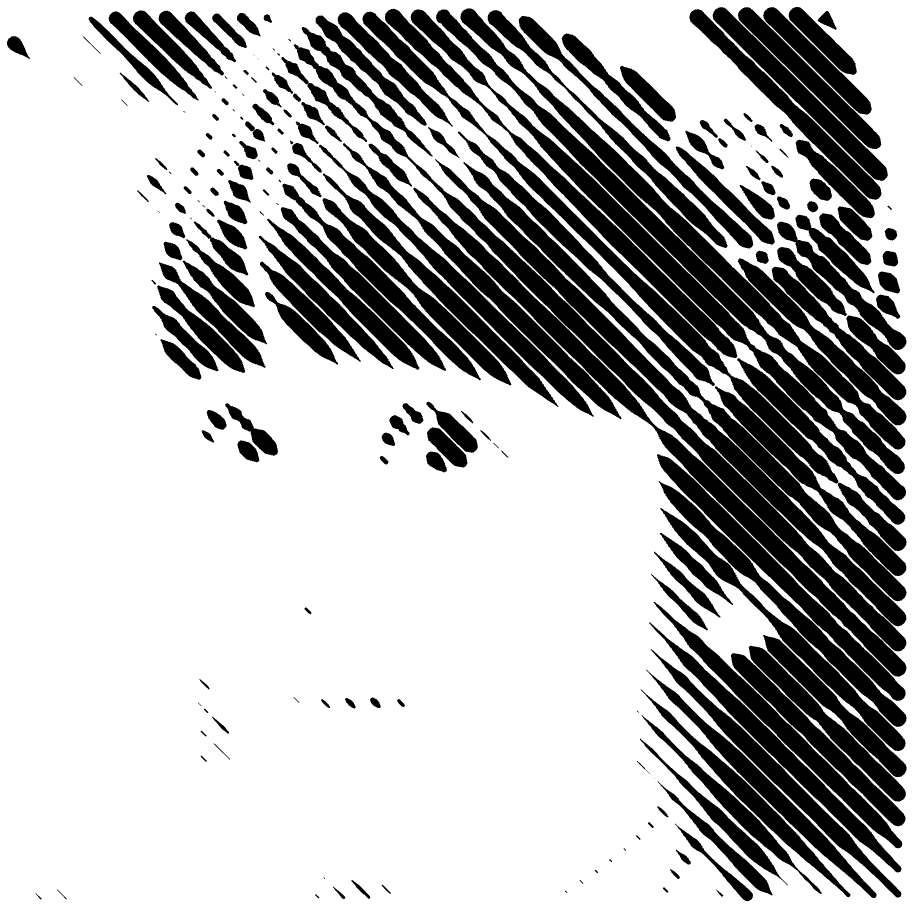
With fills that vary their line thickness, the darkest parts of the image draw the thickest lines and the lightest parts the thinnest. Move the white threshold and you shift that balance, thinning out or filling in different areas.
| threshold: 0 - 255 | threshold: 0 - 170 | threshold: 0 - 60 |
|---|---|---|
 |
 |
 |
Setting the range
Set the range of grays with the sliders, or type exact values into the input fields. You can also double-click the indicator to snap straight to the optimal threshold.
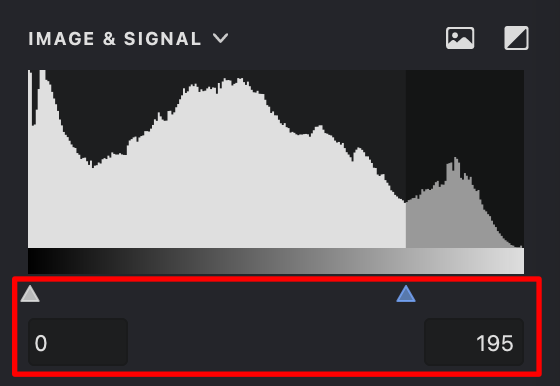
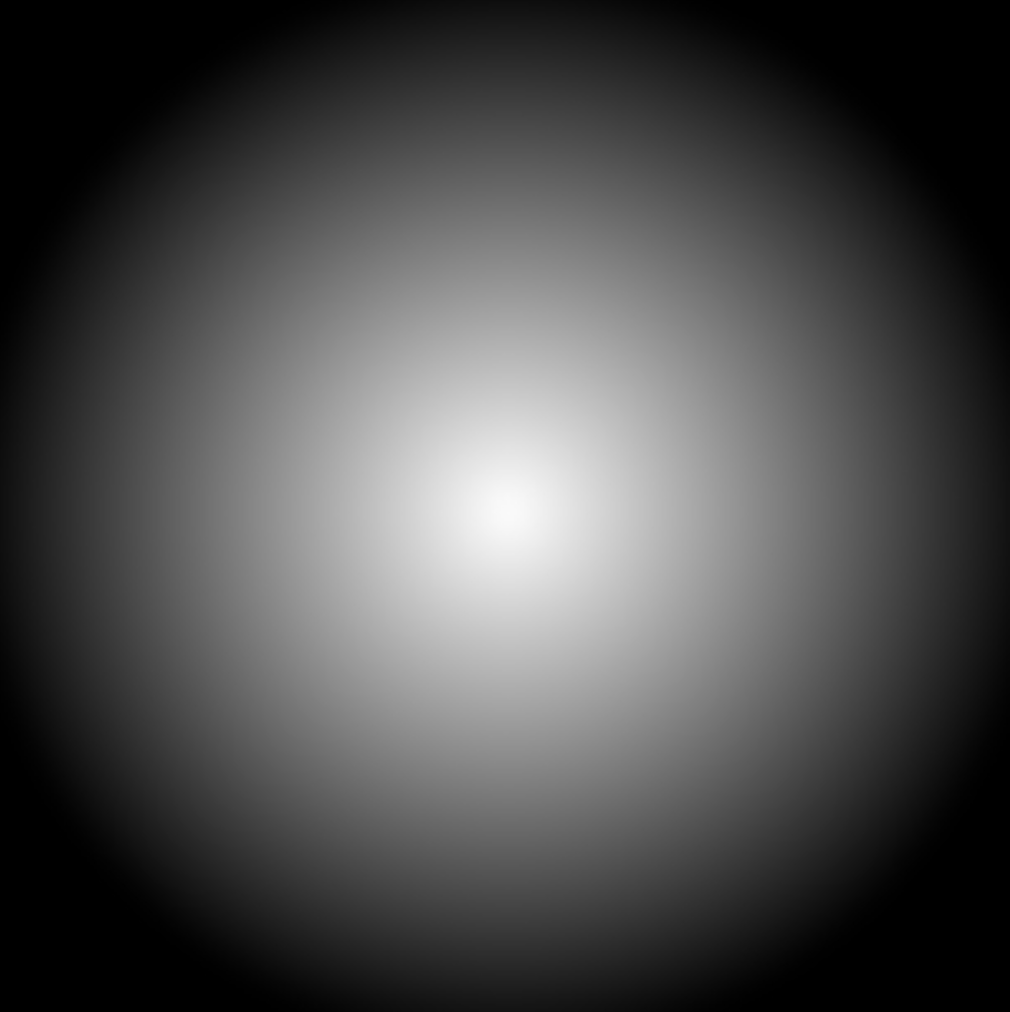
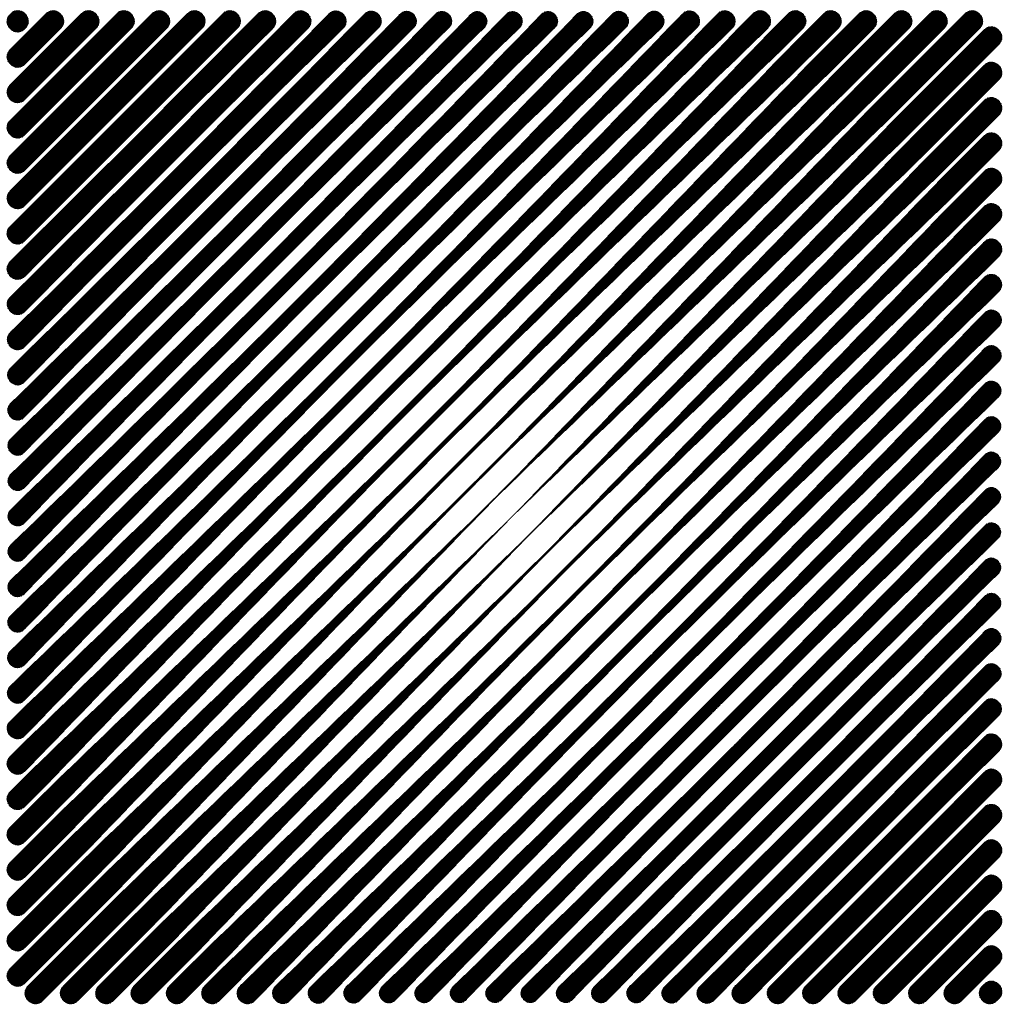
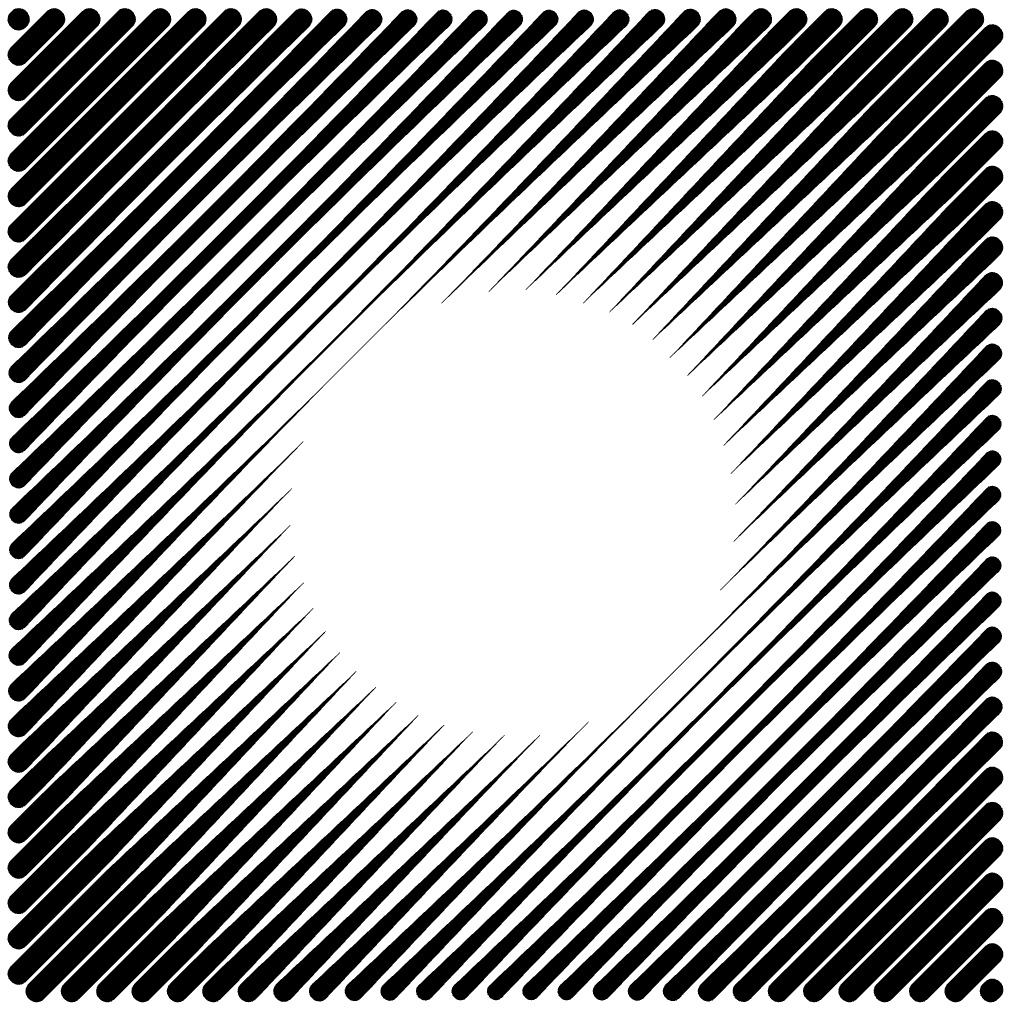
Anything darker than the minimum or lighter than the maximum drops out. In the example below, those out-of-range areas are simply left untraced.
| image | threshold: 0 - 255 | threshold: 0 - 150 | threshold: 75 - 150 |
|---|---|---|---|
 |
 |
 |
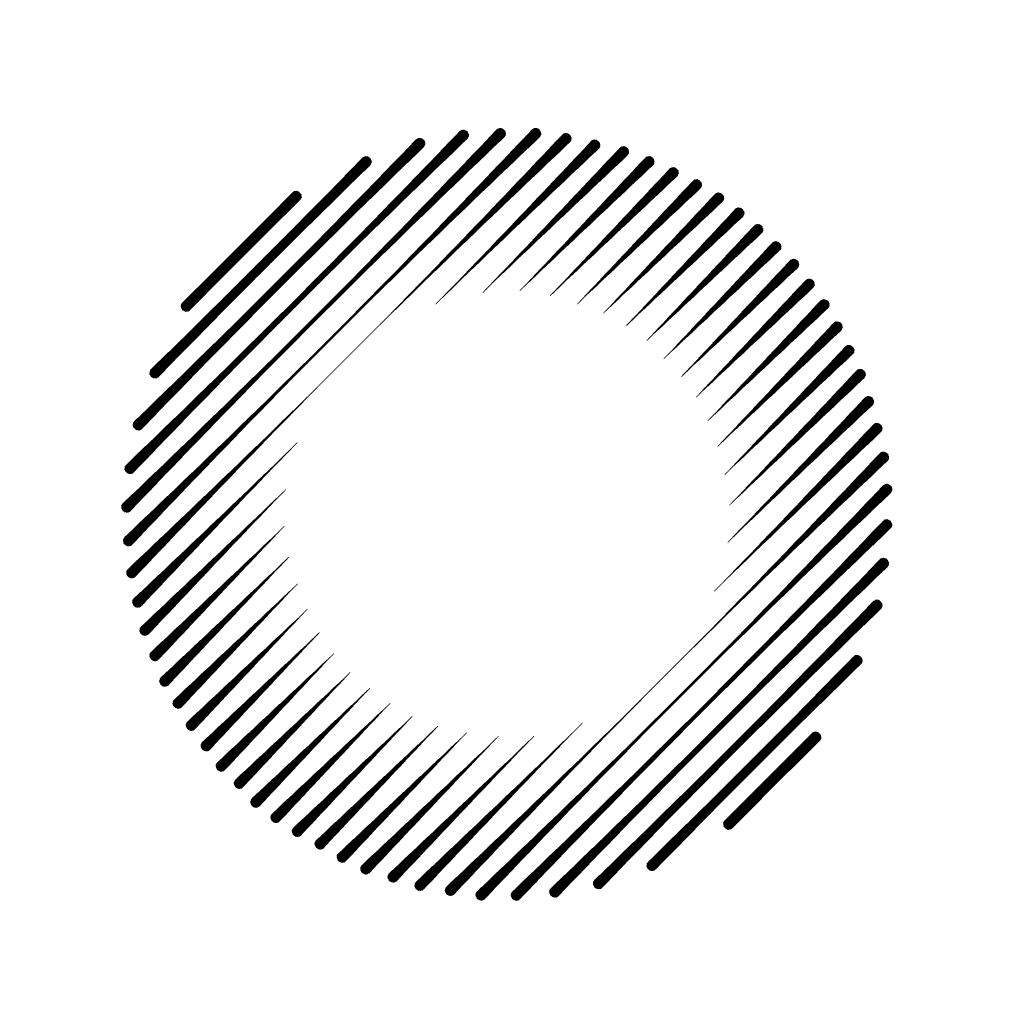 |
The trace follows only the parts of the image that fall inside the gray range you've set.
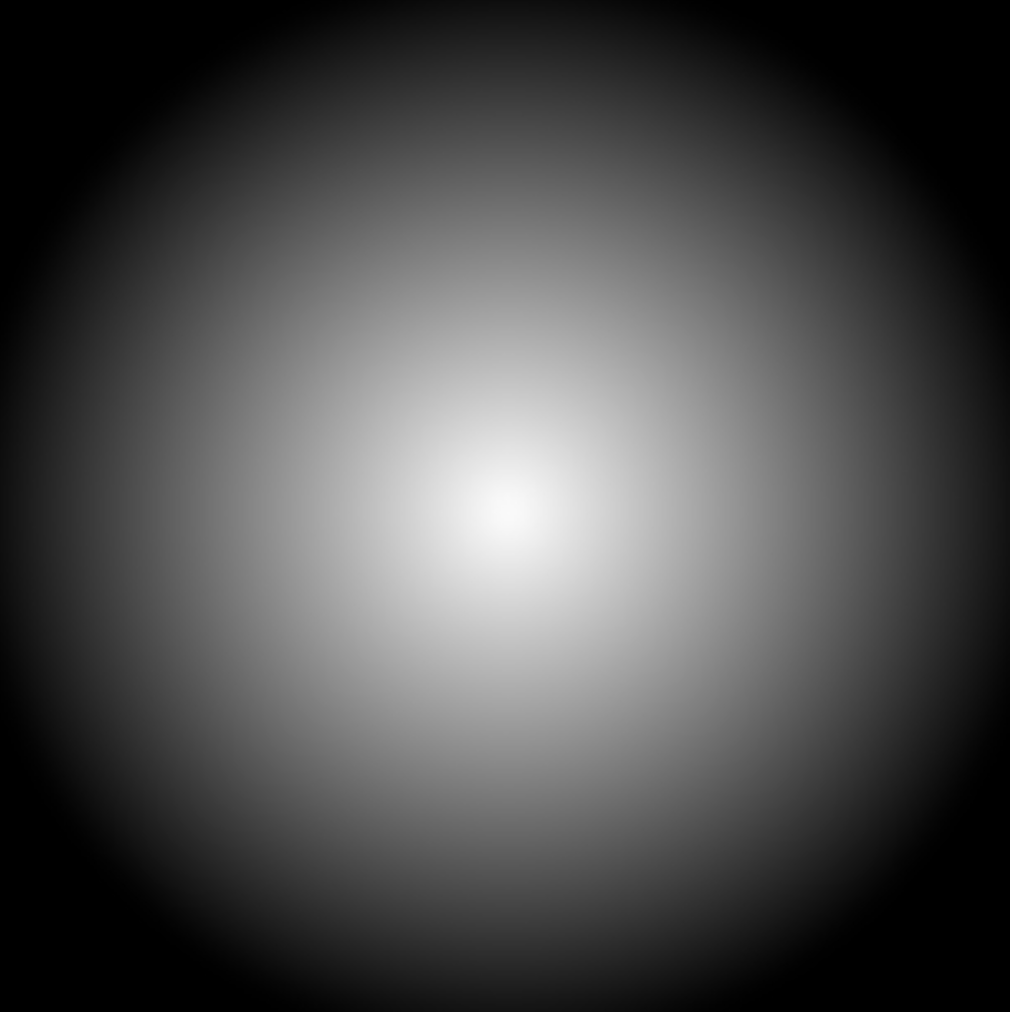
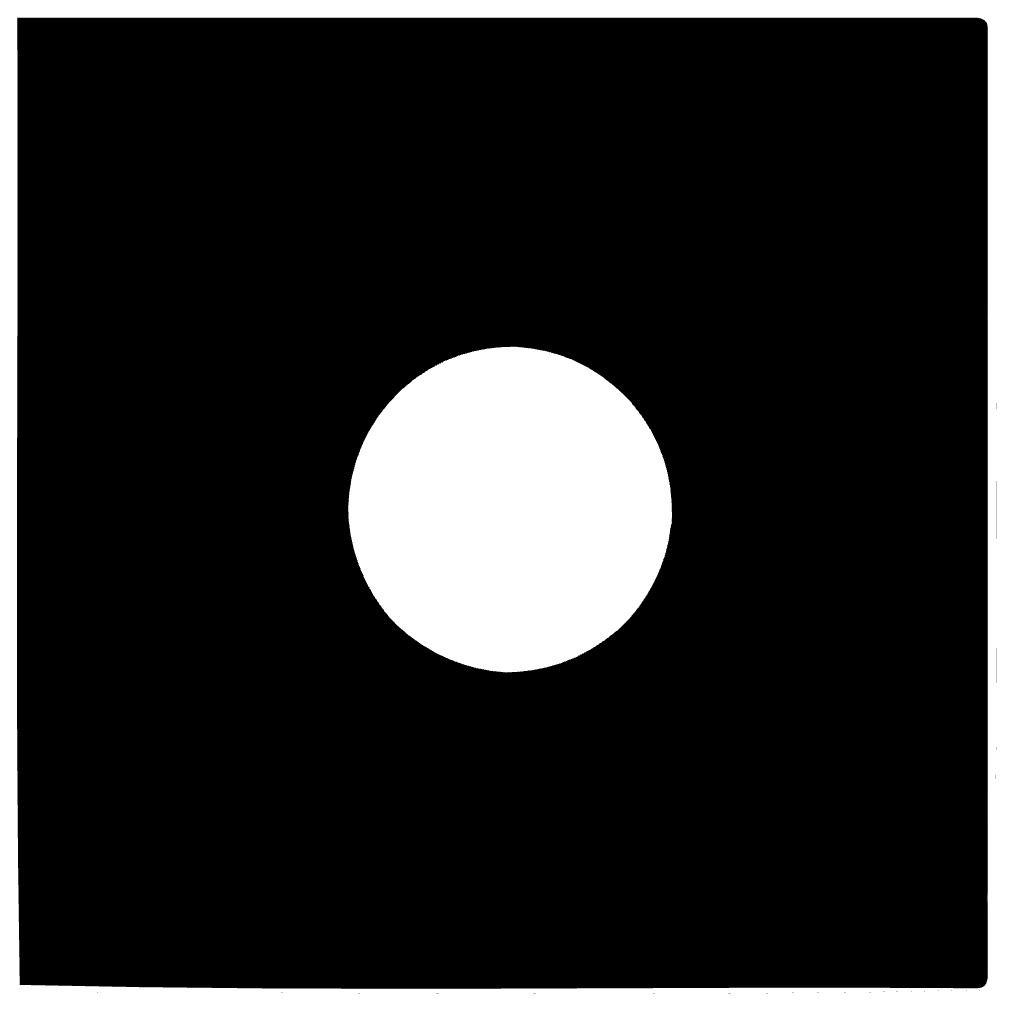
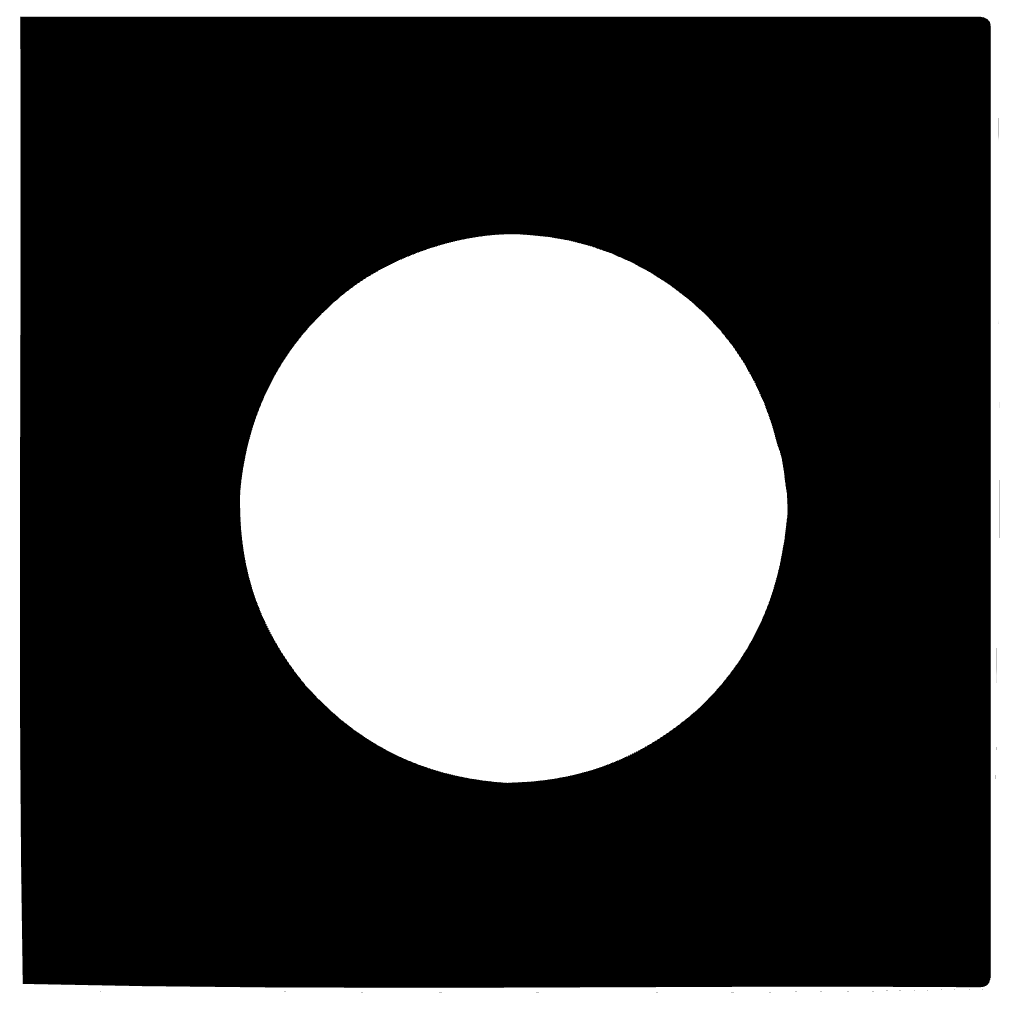
| image | threshold: 0 - 180 | threshold: 0 - 125 | threshold: 100 - 125 |
|---|---|---|---|
 |
 |
 |
 |
Inverted mode
White fills are easier to judge against a dark diagram, so you can flip it. In inverted mode , the highest value (255) reads as black and the lowest (0) as white.
Show source image
Turn on the source image  to keep the original in view. It makes comparing the current trace and previewing the effect of filters much easier.